
I am not at all a visual thinker — only when I deeply understand something can I express it spatially. As a form of meditation, I spent most of October making diagrams, from Althusser to engineering.
To inaugurate my new blog, I’ll go over some of the tricks I learned, and how TikZ (the software I use) has changed the way I think about diagrams and diagrammatic reasoning.
0. Zero
Before anything else, the first thing to do when making a diagram is to find the zero-point. Since TikZ is based on Cartesian coordinates, all other points and lines are relative to (0,0).
Sometimes it’s easy to decide, such as when a diagram is symmetric — with bilateral (left/right) symmetry, do the right side, then add a minus sign (-x,y) to get the left side.
As an exercise, try to find the zero-point in the diagrams posted below. It’s not always easy. The key considerations are symmetry, integer values (especially in loops), and ease of reuse.
This is very simple, but doesn’t come up with other software. Nevertheless, given any line diagram, I can now intuitively identify which zero-points would work best to replicate it.
1. Iteration
I’ve been asked about my internal taxonomy for the various diagrams in my collection. Curiously, a draftsman’s view often yields very different insights than a philosophical view.
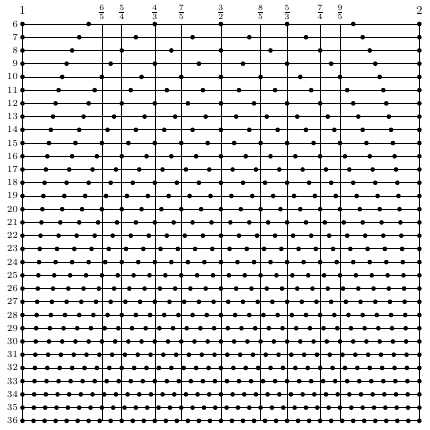
This diagram comes from the book On Sonic Art (Wishart, 1996: 74), titled “Various tempered scales and their relationship to Pythagorean ratios.” Mortifyingly, the author bodged up the ratios in the original. The reason I like this diagram is that the code is so elegant, and from what I call a draftsman’s perspective you can see this in the image itself.
From top to bottom, lines are segmented by dots into sixths, sevenths, and so on to 36ths. So we can use a loop on the first line to print a dot at 1/6, 2/6... But there’s a more general pattern: on any line, we print a dot at 1/n, 2/n, all the way to n/n. So the main part of the diagram is an embedded loop: for each n (i.e. length of a line) from 6 to 36, and then for each dot from 1 to n.
So one of the key things I look for in making a diagram is iterativity (yuck, what a word), or higher-order repetitions that make everything simpler. TikZ lends itself to this sort of analysis (as opposed to, say, Photoshop) because the user has to spell out everything.
2. Polar Coordinates
It’s humbling to express ideas as a diagram. After so much Deleuzian rhetoric about unquantifiable intensities, it’s almost humiliating to return to mere circles and lines as building-blocks of thought.
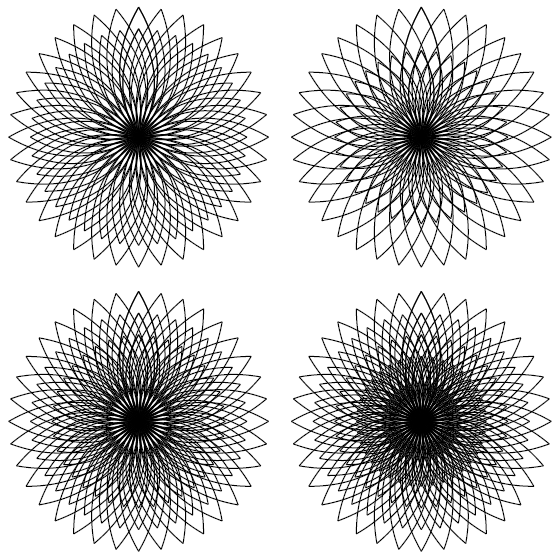
Most of my ‘original’ diagrams have come from experimenting with loops, often around a circle — such as my voidflowers above, with 36-fold symmetry.
The key to this is a bit of high school math I’d long forgotten: polar coordinates, a simple system to find the x,y-location of a circle at, say, 45o. For this (x,y)-coordinate in TikZ, we write: ({r*cos(45)},{r*sin(45)}), replacing r by the circle’s radius.
This opens the way to some wonderful loops. For a simple example, we might draw spokes of a wheel: for spokes 0 to 8, we draw a line from (0,0) to ({r*cos(45*n)},{r*sin(45*n)}). That is, we start from 0o; (the rightmost point), then to 45o, all the way to 45*8=360.
Polar coordinates have made my life so much easier, and I find myself genuinely becoming interested in the kind of math (like trigonometry) that I always hated in school.
3. Point-free Notation
In what I’m calling ‘point-free’ notation, you only need to write one coordinate, and then for others you only need to write its difference from the previous coordinate. So for example, from the point (x,y) we might draw a line (x,y)--++(1,2), where the ++ is the key to this notation, making the second coordinate equivalent to (x+1,y+2).
This comes in handy, for instance, when I have to re-use a shape: to move it, all I have to do is change the original coordinate. I feel like there are some very clever things one could do with this — possibly allowing loops that would otherwise be infeasible.
This kind of notation is in theory quite basic, but I never heard of it because I didn’t read the TikZ manual cover-to-cover, but instead learned TikZ via a patchwork of StackExchange posts. If anyone else wants to learn TikZ, I’d recommend doing likewise: learn the basics here, and the rest by personal projects, visiting TeX.SE when you get stuck.
4. 3D Diagrams
To try something new, I made a 3D diagram with PGFplots, of a time spiral / Heyser corkscrew.
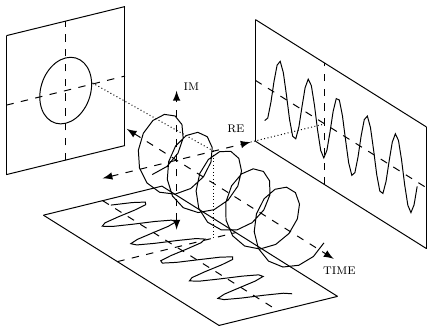
This was an absolute nightmare, since it took forever to compile. The curves are still choppy, since my poor TeX installation can’t smooth three at once.
An interesting aspect not clear from the photo alone is that now that the code is in place, I can adjust the angle to view these shapes from any perspective.
Oddly, PGFplots doesn’t truly have a 3D engine, but instead is only a clever manipulation of 2D diagrams. For actual 3D, there’s a package called Asymptote, which I’m in no hurry to learn.
It’s worth remarking how most the philosophy diagrams I’ve made so far are fundamentally flat, with the magnificent exception of Lévi-Strauss. It’s common to see what @deepchimera calls ‘Aristotelian’ diagrams, essentially a box with two axes and lots of labels. I haven’t seen a single philosophy diagram with an x-axis, y-axis and z-axis.
I can’t help but wonder how 3D diagrams could be used in philosophy for multivariate forms of thought. So often, rich concepts quickly become travestied into binary oppositions — perhaps a diagram can, better than anything, help to prevent this.
5. Randomization
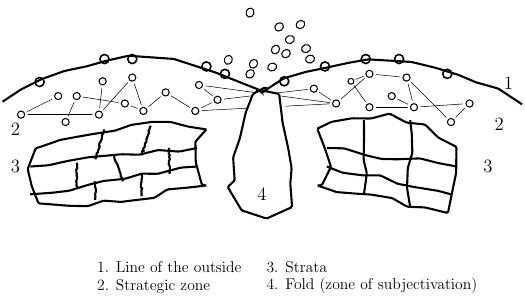
As with so many things, I put off learning this for a long time, but it turned out to be easy. I feel like this opens the way to reproducing a lot of artistic line art, provided we don’t demand an exact copy. In this spirit, I find that randomization helps very much in making Deleuze’s diagrams feel much less mechanical, and more like the scribbled original.
This is a huge turning point for me. After starting out drawing simple diagrams with lines and arrows, it’s all of a sudden possible to create elaborate whisps and knots that I had long considered to be beyond the scope of TikZ. Where I am is a whole new state of open-mindedness, seeking out new lines and forms, going not only from idea to diagram but also from diagram to idea.
Diagrammatology
There’s a tendency to think diagrams are meant to simplify. Diagrams can also complexify: taking ideas we think we know and revealing associations more rich than we realized.
Diagrammatics in philosophy is sadly neglected, with few incentives to go to so much trouble. Still, I like to imagine a Journal of Diagrammatics with each article explicating a single original diagram.
For my part, my goal is to be able to make nice, original diagrams to illustrate ideas. So my next step is making my own diagrams. I realize most of them will be awful at first. Yet, the very thought of conceptual diagrams as a skill raises tons of interesting questions.
Most diagrams are radically singular — we could never imagine coming up with it ourselves. Further, diagrams span all human knowledge; I’ve found beautiful examples even in color TV manuals and books on negotiation. And yet, we all feel that some diagrams are better than others, implying the existence of diagrammatic principles, irreducible to mere standardizations (like bar charts).
I once imagined a treatise on tesseractics, starting from Greimas’ semiotic square and 2×2 matrices, building Lévi-Straussian intuition via graph-theoretic anthropology, and then at last, visualizing(?) post-Hintonian hypercubic metamodels. I deeply want this book to be real. Maybe it can be.